Update: Sept 9, 2009: Mac OS 10.6 Snow Leopard now has this feature built into Instruments! In Xcode, choose “Run -> Run with Performance Tool -> Zombies”, and repeat your steps that cause the crash. Easy as pie. Read on if you don’t have Snow Leopard…
Mac OS 10.5 Leopard has a great new developer app called Instruments.
It can easily be used to debug those “random crashers” in your application caused by too many -release or -autorelease calls. Let’s see how.
If you want to follow along, download this project: CrashTestDummy.zip
Open it up in Xcode.
The nib has two outlets in it: a basic NSObject called testObject and button setup to invoke the following code:
– (IBAction)buttonCrashTestAction:(id)sender {
// We are going to autorelease the testObject too many times..
[testObject autorelease];
}
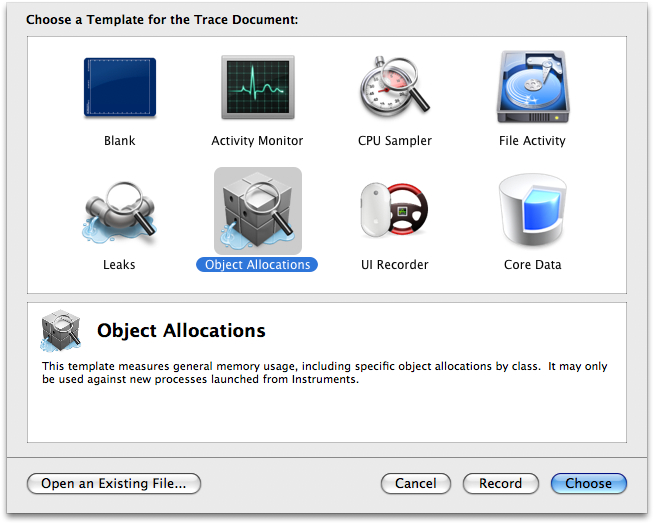
So, we will hit the button a few times and we should get a crash. Compile the app with the Debug target. Start Instruments, and select the Object Allocations template:
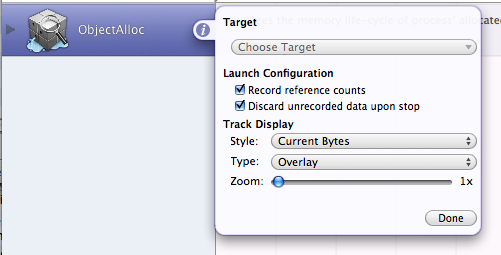
Hit the purple “i” next to the instruments to bring up the inspector for it, and be sure to check “Record reference counts”, as seen below:
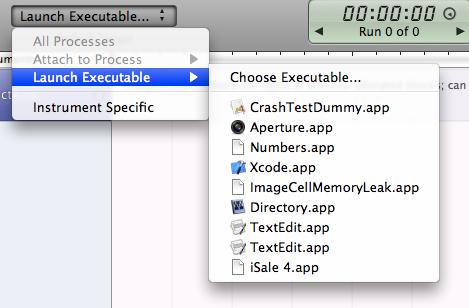
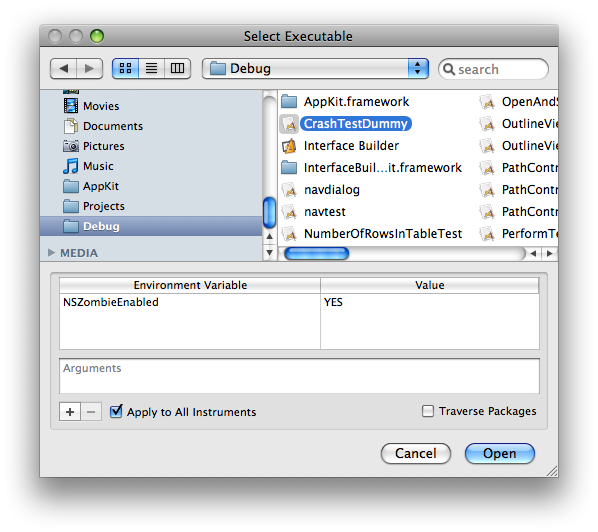
Cool. Click “Launch Executable” and select “Choose Executable”, and find CrashTestDummy.app from the built directory.
While you have the Open Panel up, add the environment variable NSZombieEnabled and set it to YES (sort of an optional step):
Hit Open, if you haven’t already done so.
Hit “Record” in instruments, which will start the app, and click the “Crash Test” button a few times until the app crashes.
Alright! Fire up Console.app and look for a line like this:
![]()
The important part is the address, 0x150d40, in this case.
In Instruments, move the mouse to the right of “All Allocations” and a little triangle appears:
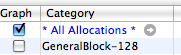
Click on it to see all the allocations.
In the lower right hand corner of instruments click on the magnifying glass in the NSSearchField and select “Address”:
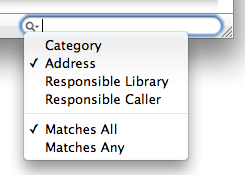
Type in your address, and you should see all allocations at that address:
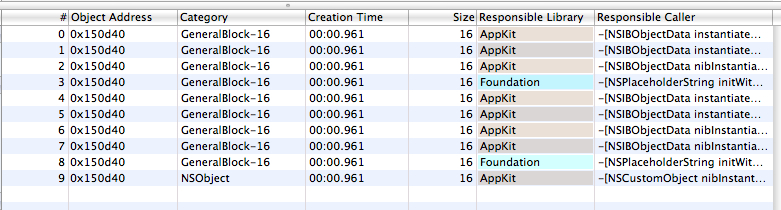
Now, why so many? Well, addresses are reused. Chances are, the last allocation is your object, and sure enough, it is, since we know we are over releasing an NSObject instance. Click on that item, and you’ll see the history for it. Scroll to the bottom to see just the history for that NSObject:

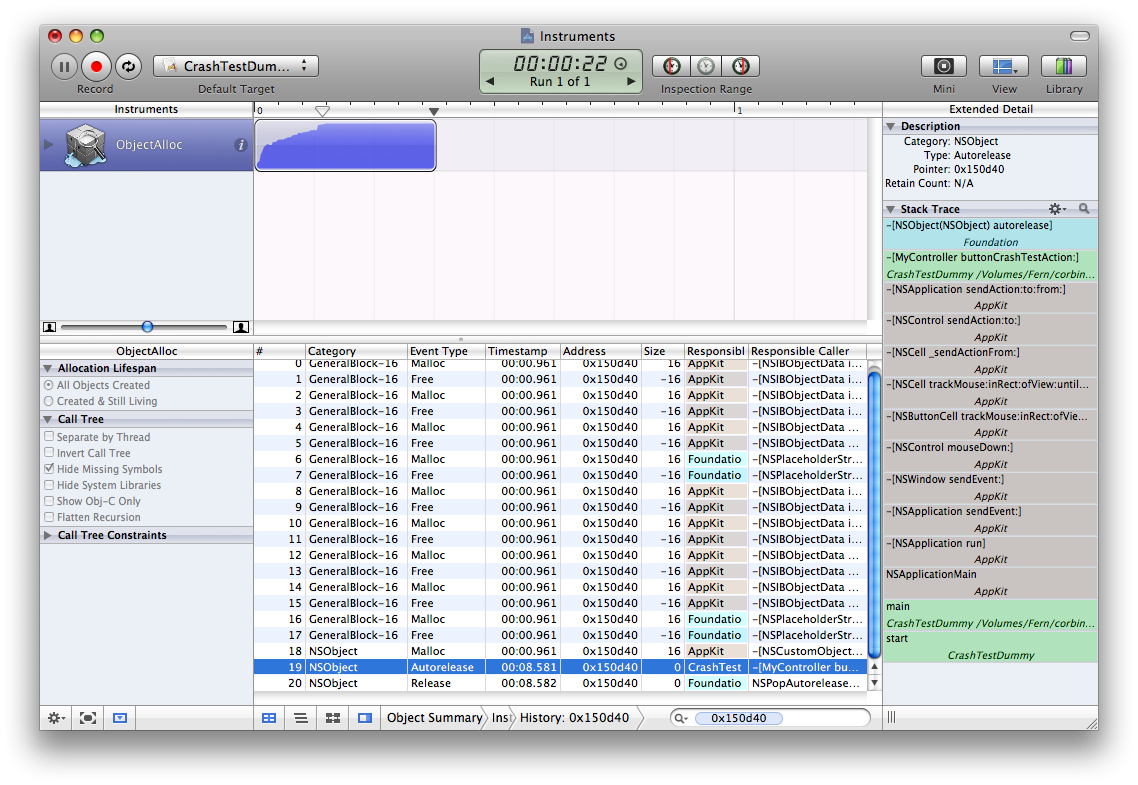
Now! You should be able to figure out which release probably shouldn’t be there. We know it is #19 from our demo, but sometimes it isn’t that easy to figure out. Select #19’s row and then click the little gray arrow to next to its address (or whatever yours is), and then click on this button at the bottom of instruments to show the stack trace / extended detail:
![]()
You can then see when that “bad release” happened. Click on the thumb below for a full size screen shot of it.
Ahh! Way cool. Of course, this was a simple and easy test case.
Happy debugging :)
corbin


Good stuff!
FYI, your site has problems rendering in Tiger Safari and NetNewsWire (text running off the right edge or getting clipped)
[…] nstruments is the name for Mac OS X’s UI overlay to the mighty DTrace. Corbin has up a nice Instruments walk through on his blog, including a nice bit of “download the project̶ […]
Hi! I am currently looking into XCode and Leopard looks nice. I will be following this blog again. Could you e-mail me?
Very nice demo, Corbin. Do you have some tips for using Instruments to track leaks as well?
Yeah, I know about the site formatting issues…i need to fix it! I think it is an overflow issue.
(Also, sorry about the really late moderation…)
Adriaan — leaks are super easy using the “leaks tool”. Usually, it is just a matter of matching up retain/releases until you find what didn’t do the release. Maybe I’ll do a write up on that soon.
Thanks Corbin for this post. It’s still early days for Instruments and examples of it in use are really valuable. I have a couple of questions.
First up, why do you say the use of NSZombieEnabled is “sort of optional”? Is it needed to get the address to print out in the Console?
Secondly, if I run the app from Xcode, the Debugger opens when it crashes with a stack trace indicating the same -[myController buttonCrashTestAction:] method as the culprit. What is the advantage of going through the steps you outline here? Is it because the message to the overreleased object may actually be sent long after the object was released?
Robert — I guess it is required. If your app does a plain old crash, you will generally have the address, and can lookup things based on that.
To answer your other question — the main reason to use these steps is to find the point of the over release. More often than not, it isn’t as easy as this contrived case, and the debugger crashes at a more random spot when the memory is referenced much later than when it was freed.
-corbin
[…] Instruments on Leopard: How to debug those random crashes in your Cocoa app […]
[…] ??? ???? ??? Intruments? ???? ??? ?? ??. Instruments? ?? ??? ???? ??. […]
I have a app that has an over-release bug which occurs only when I run it on the iphone. I can launch the iphone app from instruments and record the trace with “Record reference counts” turned on. But where do I see the log?
Great article!!!! You don’t know how much this helped!!!!
Corbin:
Great article! If you have the time, a PDF of this would be invaluable. We’d all have it on our desks for reference!!!
John
Fantastic resource – helped me track down an annoying zombie in no time flat! Thanks.
Outstanding! With this, it took me five minutes to find what I had been looking searching over an hour.
To echo some people above: Thank You!
I spent hours trying to figure out what I had mistakenly released and this found it in 5 minutes.
QDHMEQ lmmnijladjil, [url=http://kuucvchfjvcx.com/]kuucvchfjvcx[/url], [link=http://kfqodwgithni.com/]kfqodwgithni[/link], http://mxfhyxtlvxsp.com/
Thank you very much! great post. Will recommend it.
My brother recommended I might like this blog. He used to be entirely right. This put up actually made my day. You cann’t imagine simply how so much time I had spent for this info! Thanks!