Accelerometer woes
I have a accelerometer/gyro/compass combo in my wheel LSM303DHLHC, data sheet: http://www.pololu.com/file/download/LSM303DLHC.pdf?file_id=0J564 found via Pololu’s link: http://www.pololu.com/product/1268
It has been tough to figure out consistent data. First of all, I realized the compass has to be calibrated. There is a sample app included with the LSM303 Adruino code called “Calibrate”. It just reads the compass/magnet data a keeps a running max and min value of what it sees. First off, I kept getting strange values out of it; specifically -4096. I later learned from the Polo website that this is an overflow condition in the chip and it is documented on the data sheet. First of all, it is documented on a data sheet, but not the one for the LSM303DHLHC. I’m sure they use the same accelerometer chip though. The fix according to Pololu is to adjust the gain (and that works). Here are possible values:
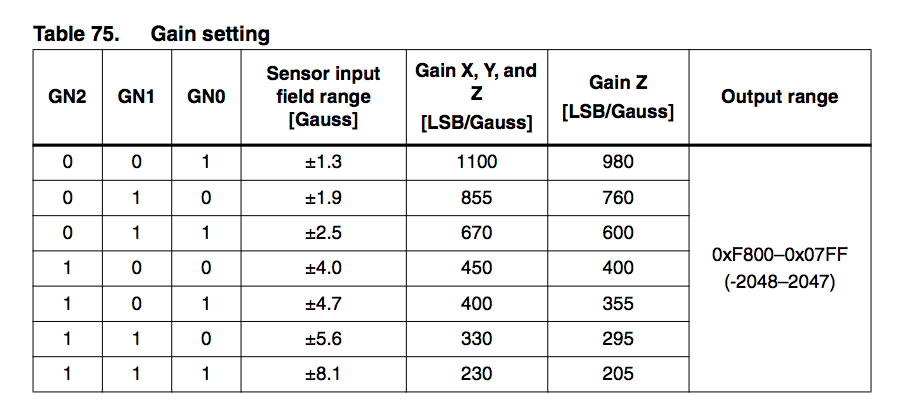
The default is 0,0,0 which means a “Sensor input field range” of +/- 1.3 Gauss. I don’t really know what a gauss is, and I’m not sure why a higher or lower gain is important. But with the default value it was overflowing the buffers in the accelerometer chip, so I changed it to: 1, 0, 0 with this:
_compass.writeMagReg(LSM303::CRB_REG_M, 0b10000000); // gain: ±4.0 Gauss (see datasheet)
Which is +/- 4.0 gauss. The gain reading values are lower, and don’t overflow anymore. That’s a plus. I’m using the Pololu modified sample “Pololu MinIMU-9 + Arduino AHRS (Attitude and Heading Reference System)” to get cool graphs/pictures:
.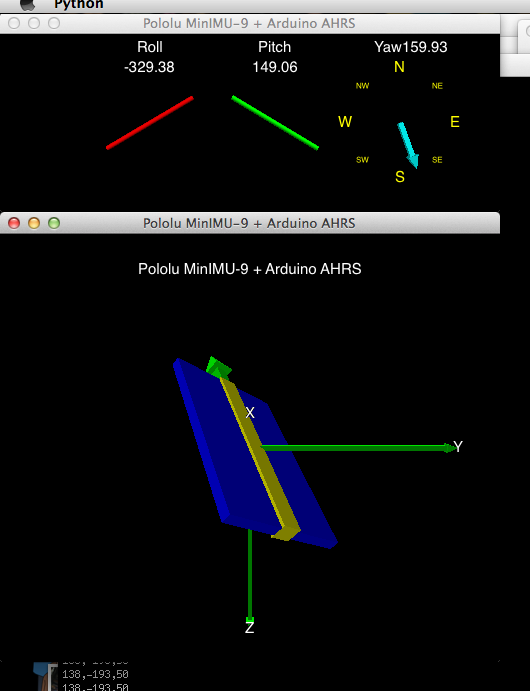
It is a python script, and has a bunch of dependancies, but they are easy to find and download for the Mac. I had to tweak the script to get it to run:
1. Fix the serial port:
ser = serial.Serial(port=‘/dev/tty.usbmodem23981’,baudrate=115200, timeout=1)
2. Toss in a “rate(100)” in the while loop:
while True:
rate(100)
It took me a while to discover that last bit, and I only figured it out after reading a demo script.
I still was getting strange results; not quite an accurate position. So, I outputted the raw x/y/z magnet data to a comma delimitated file and opened it in Grapher:
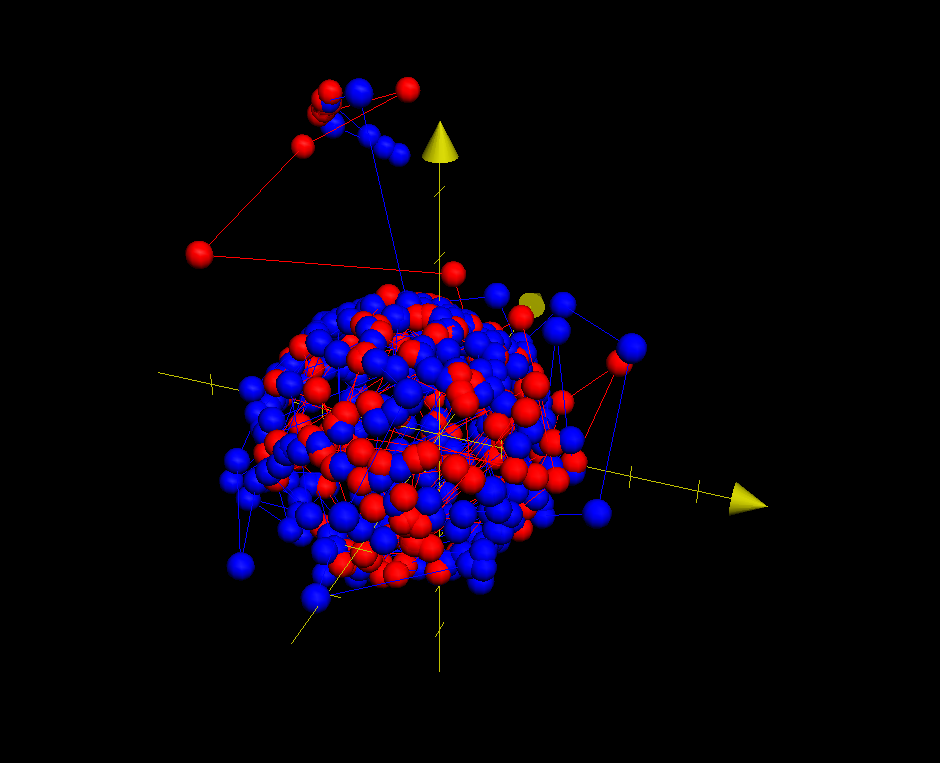
You can create a Grapher.app doc on the Mac (the app comes with OSX) and do a 3d graph. Add a Point Set, and at the top of the window click Edit Points…and import a file. I imported two; one is red, one is blue. Notice I have some rather odd stray points; I think these are causing part of my problem.
I might try to do some type of better averaging of the min/max values and through out the highest and lowest absolute values. More fun math to figure out….but that might correct my problems.