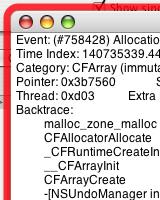
1) Open your application in Object Alloc
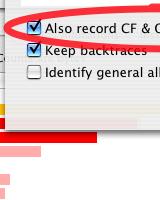
2) Start the process, and check to have retain events:
3) Run to a known state
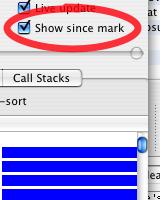
4) Check "Show since mark"
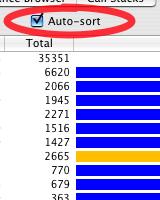
5) Click "Auto sort"
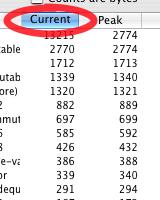
6) Click the "Current" column header to sort on that automatically
7) Click the Mark button
8) Do the offending memory leak operation (to warm it up)
9) Click Mark again, and repeat the offending memory leak operation
10) Take a look at the Instance Browser, and find your objects that are leaked
11) Pause the app, and in the right hand browser column will be the
allocation events. Double click on them and you can see the stack of
the allocation/retain/release event, and figure out who isn’t "playing
nice" by seeing who should have done a release for a corresponding
alloc/retain/copy
