BMS Display part 4 – graph
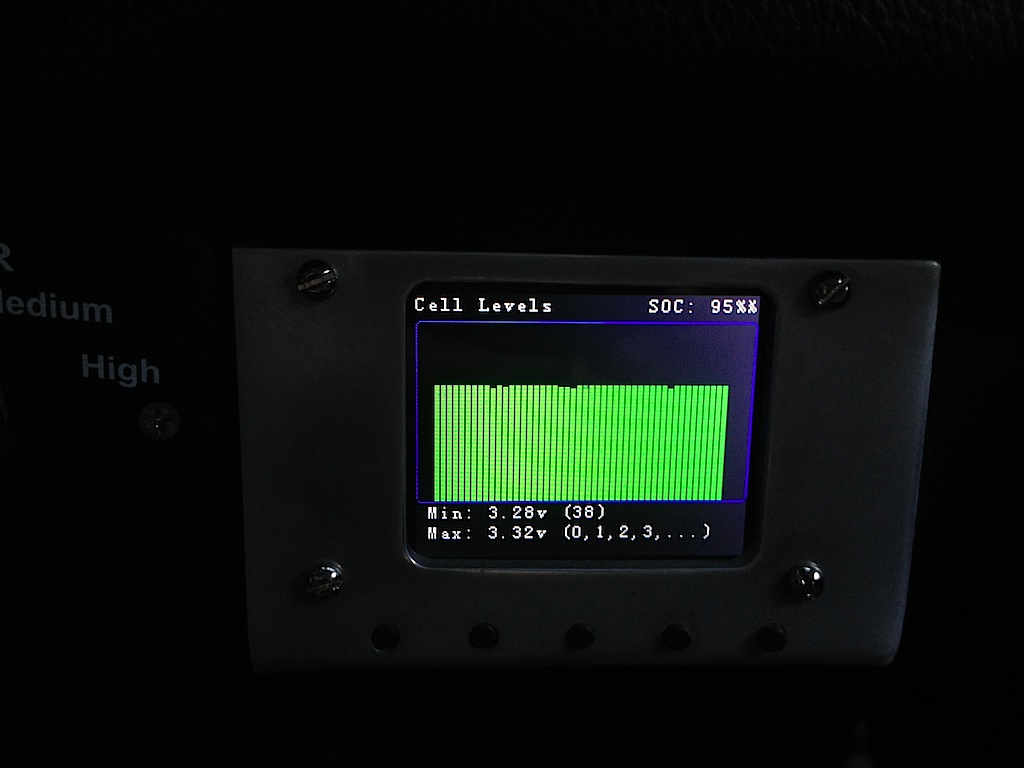
I updated my BMS display software to actually respond to the buttons I have. Now I have another screen of data, graphing each cell. The graph goes from 2.0v at the bottom to 4.0v at the top and shows the min and max cell numbers (and the voltage). My cell #38 is dying. It is starting to trip my BMS when my pack is only 50% charged. Actually, it shouldn’t be tripping the BMS because it does sag to a pretty low voltage, but it always comes back up to > 3.00v when resting (i.e.: under no load).
The updated display:
The code is also on github for my user corbinstreehouse.
Here is a video of it in action. Sorry, it is shaky, but that is because I’m holding my phone in one hand while driving a small mountain road.
My bad cell can be seen in this screen shot:
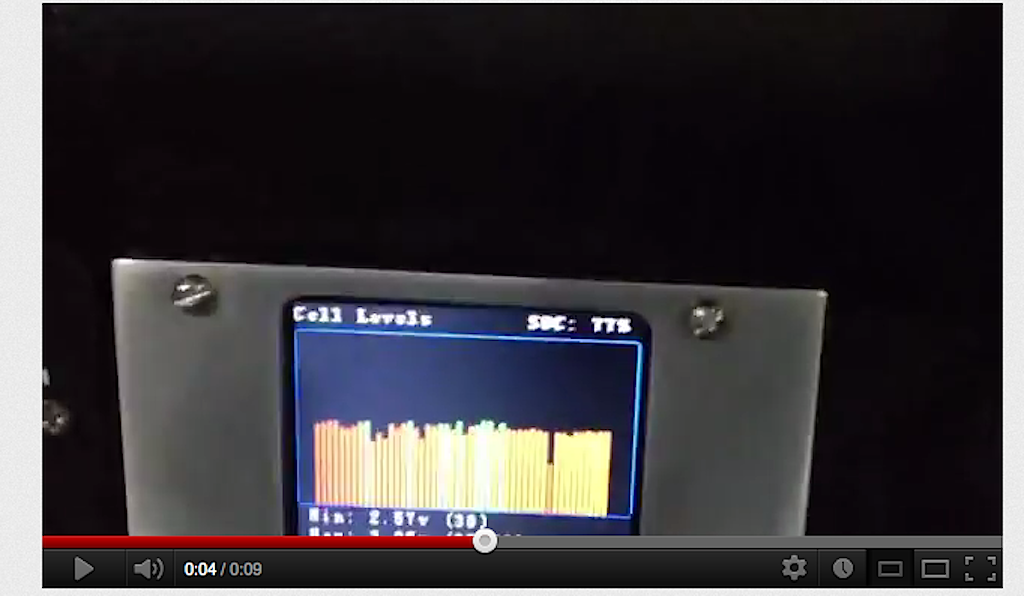
It is sagging to 2.57v under load! I draw the line in red when it is less than 2.8v, and orange when it is less than 3.0v (and green when under normal voltage).